Austin proper, Northwest Hills and new construction are moving differently. Here is what the latest data means for Austin buyers and sellers.
Austin’s September market update is not a single up-or-down story. The latest data shows a softer citywide median price, a stronger result in Northwest Hills, and a sharp new-construction median decline that needs context before it is treated as a value trend.
The short answer is this: buyers have more choice, correctly positioned homes can still move, and sellers need a pricing strategy based on the exact property and segment rather than a metro-wide headline.
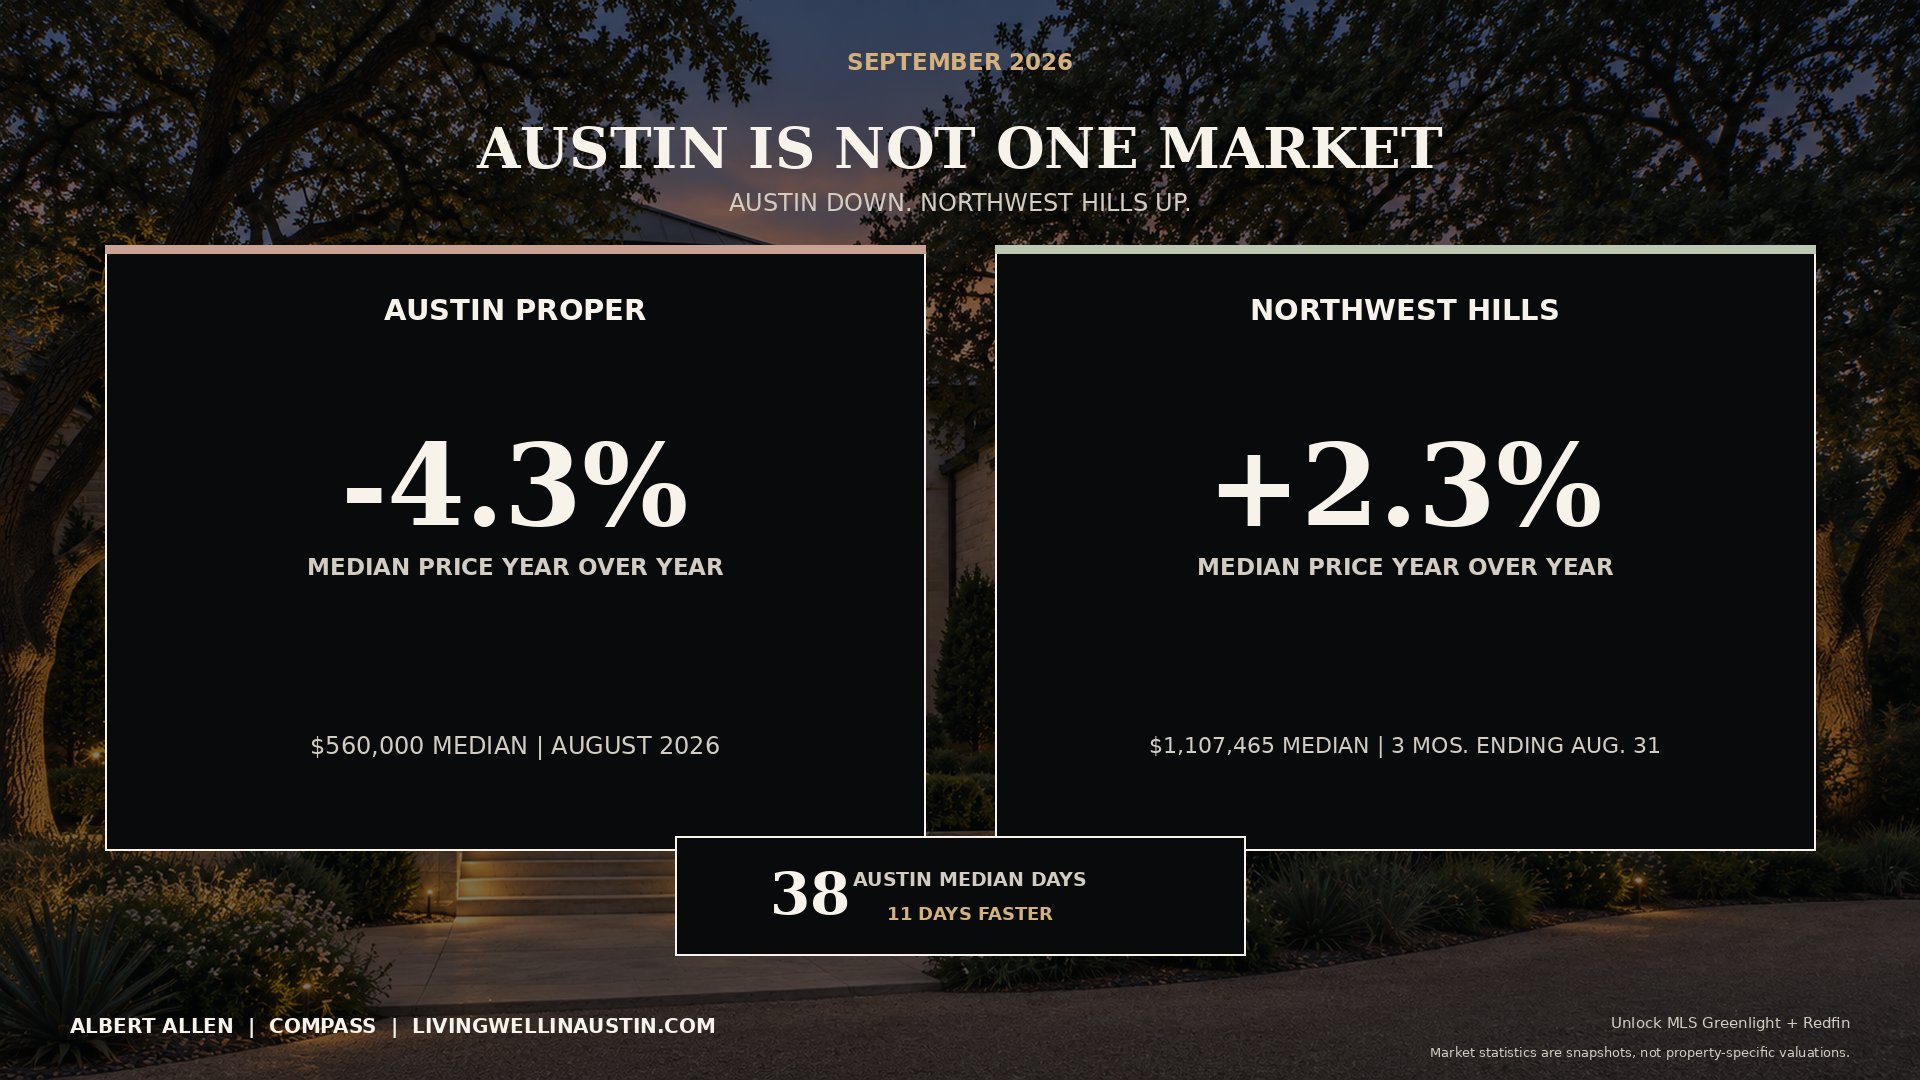
At a glance: Austin proper: $560,000 median, down 4.3% year over year. Northwest Hills: $1,107,465 median, up 2.3%. New construction: $440,915 median, down 39.5%, with the result highly sensitive to the mix of homes that closed.
The short answer: Austin is not one market
Three segments can move differently in the same month because they contain different homes, price bands, locations and levels of new inventory. That is why a citywide median is useful for orientation but not for pricing a specific house, condo or new build.
- Austin proper showed a lower median sale price but faster closed-sale timing.
- Northwest Hills posted a higher median price and a large increase in sales activity within Redfin’s neighborhood boundary.
- New construction carried more supply and a much lower median sale price, partly reflecting which homes closed during the month.
Austin prices fell, but sold homes moved faster
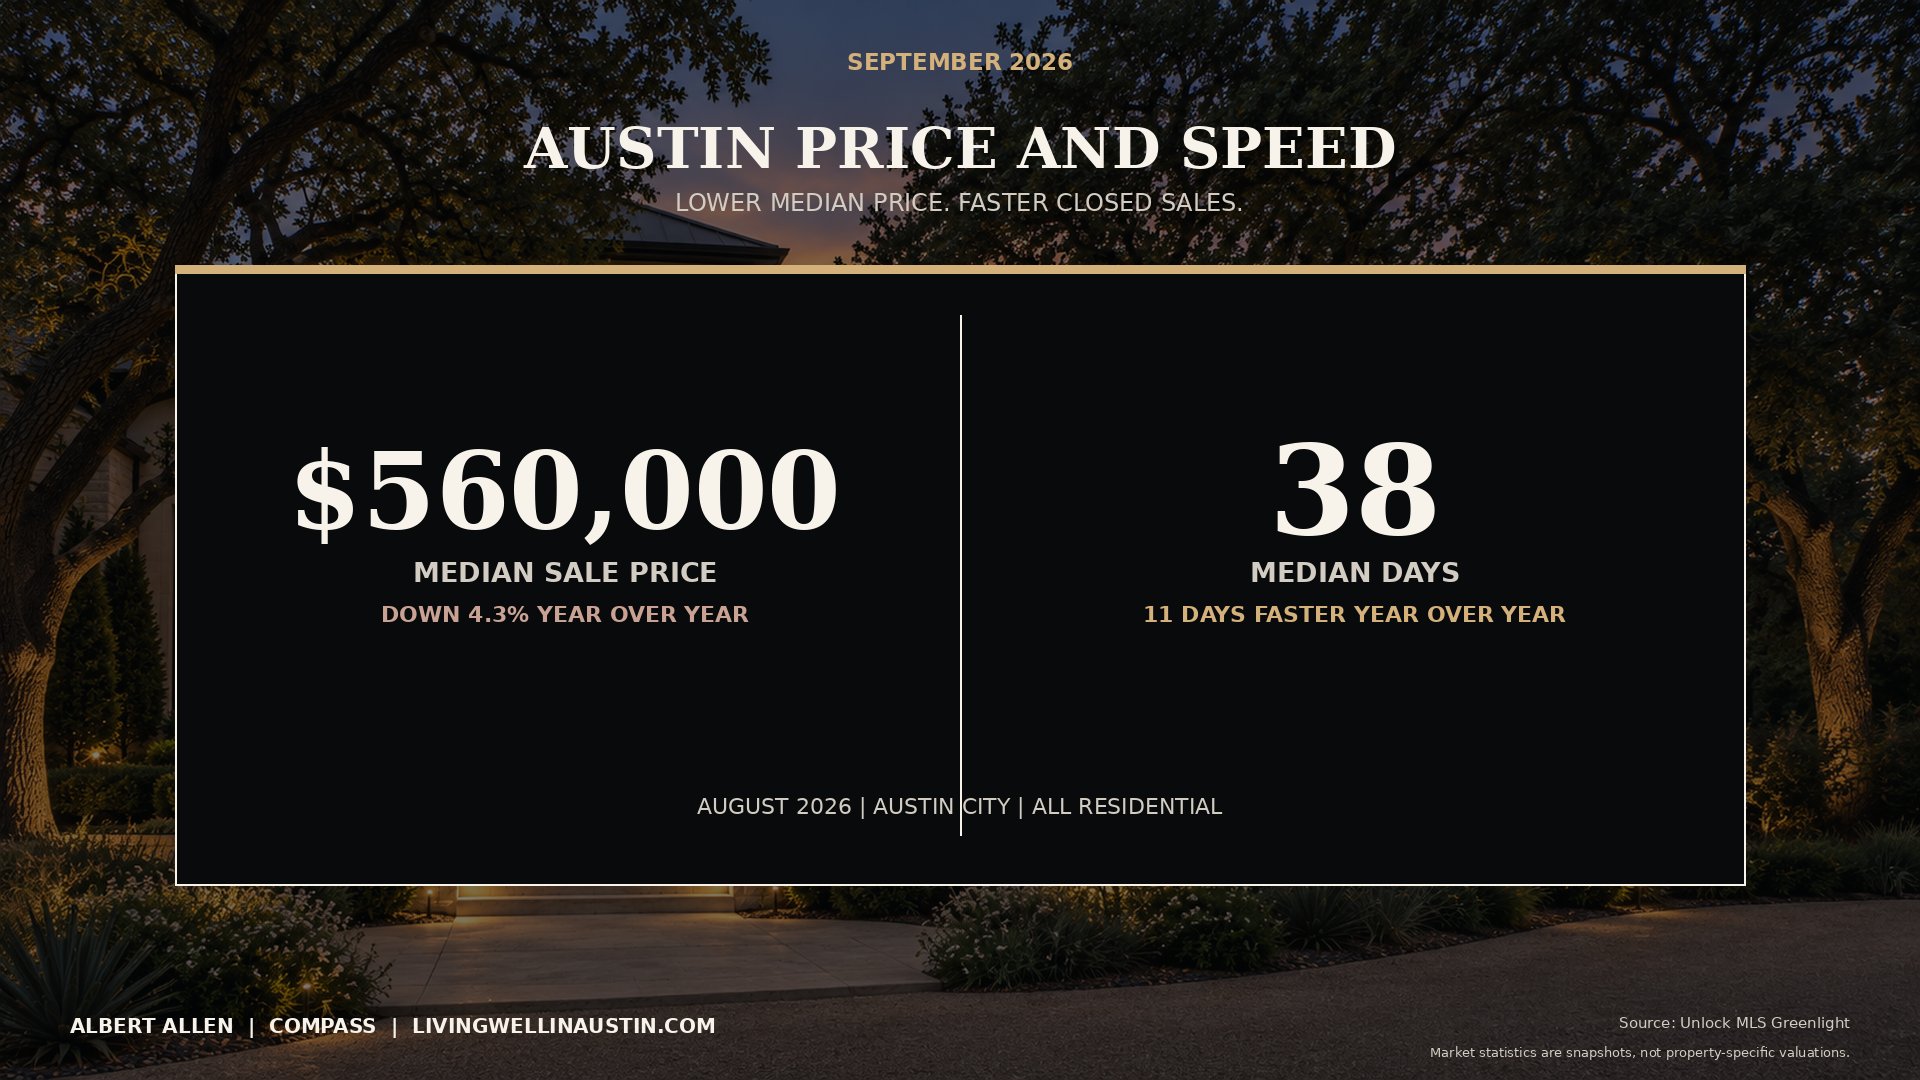
In Austin proper, the August 2026 median sale price was $560,000, down 4.3% from a year earlier. Closed sales totaled 870, down 7.5%. At the same time, the median time to contract was 38 days, which was 11 days faster than the prior year.
That combination matters. A lower median price does not mean every home lost 4.3% of its value, and faster timing does not mean every listing was competitive. The median can shift when a different mix of lower-priced or higher-priced homes closes. For an individual property, condition, location, updates, price band and competition remain decisive.
Supply is giving Austin buyers more choice
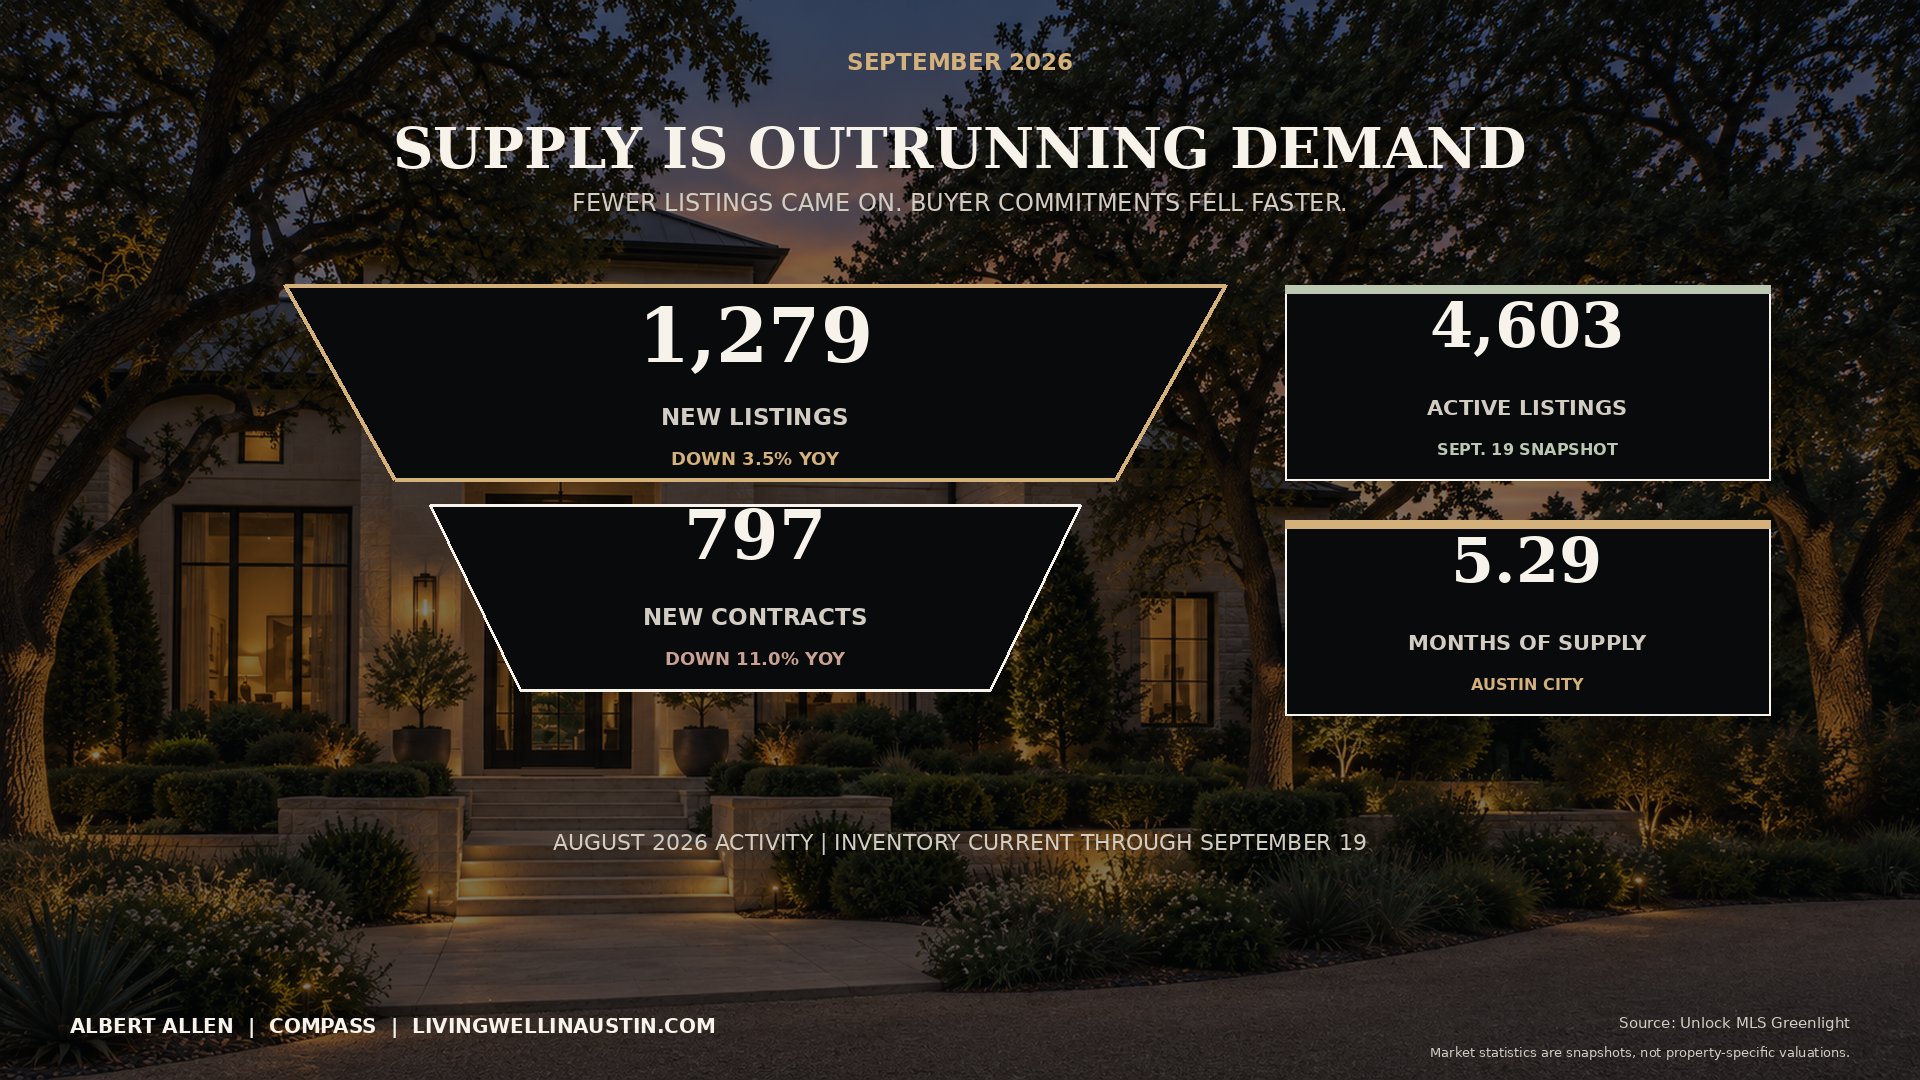
Austin recorded 1,279 new listings and 797 new contracts in August. There were 4,603 active listings as of September 19, and the city carried 5.29 months of supply. New listings were down 3.5% year over year, while new contracts were down 11%.
The wider gap between available homes and new contracts gives many buyers room to compare options and negotiate. The Unlock MLS Greenlight close-to-original-list measure was 93.32% in August, another sign that list price and final terms can diverge. That does not make every listing a bargain. It makes property selection and comparable-sale analysis more important.
Northwest Hills moved in a different direction
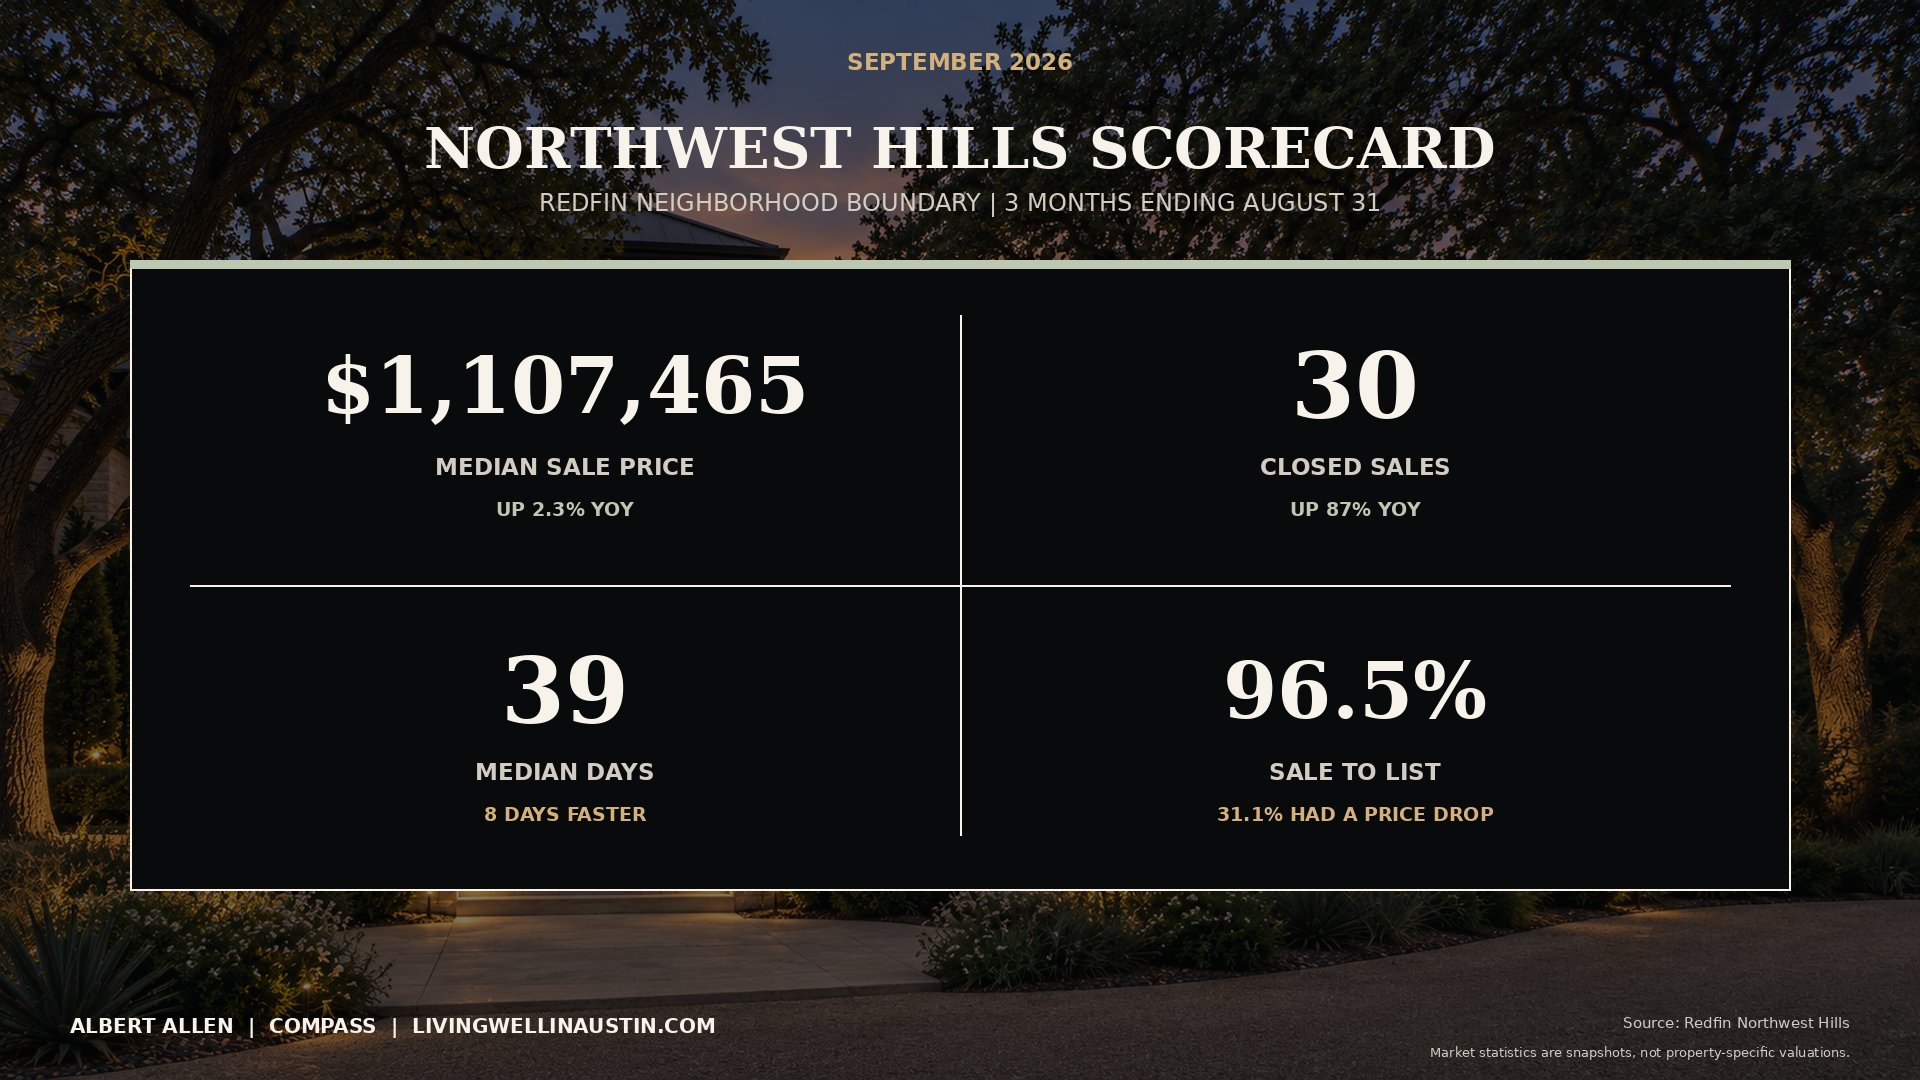
Within Redfin’s Northwest Hills boundary, the three months ending August 31 produced a median sale price of $1,107,465, up 2.3% year over year. There were 30 sales, up 87%, and the median time to contract was 39 days, eight days faster than a year earlier. The sale-to-list ratio was 96.5%, while 31.1% of listings recorded a price drop.
The neighborhood result is stronger than the citywide median trend, but it still rewards disciplined pricing. A seller can see both a higher area median and meaningful price reductions in the same period. Buyers should compare homes by street, condition, lot, architecture and renovation level rather than assuming every Northwest Hills listing behaves alike.
For owners weighing updates before a sale, see Energy-Efficient Home Features in Northwest Hills Explained. If the property is near Bull Creek, the latest Bull Creek access and permitting update also provides useful local context.
Why 78731 and 78759 are context, not Northwest Hills
ZIP codes help explain the surrounding market, but neither ZIP is a perfect substitute for the neighborhood. Northwest Hills overlaps parts of 78731 and 78759, while both ZIP codes include homes outside the neighborhood’s commonly used boundaries.
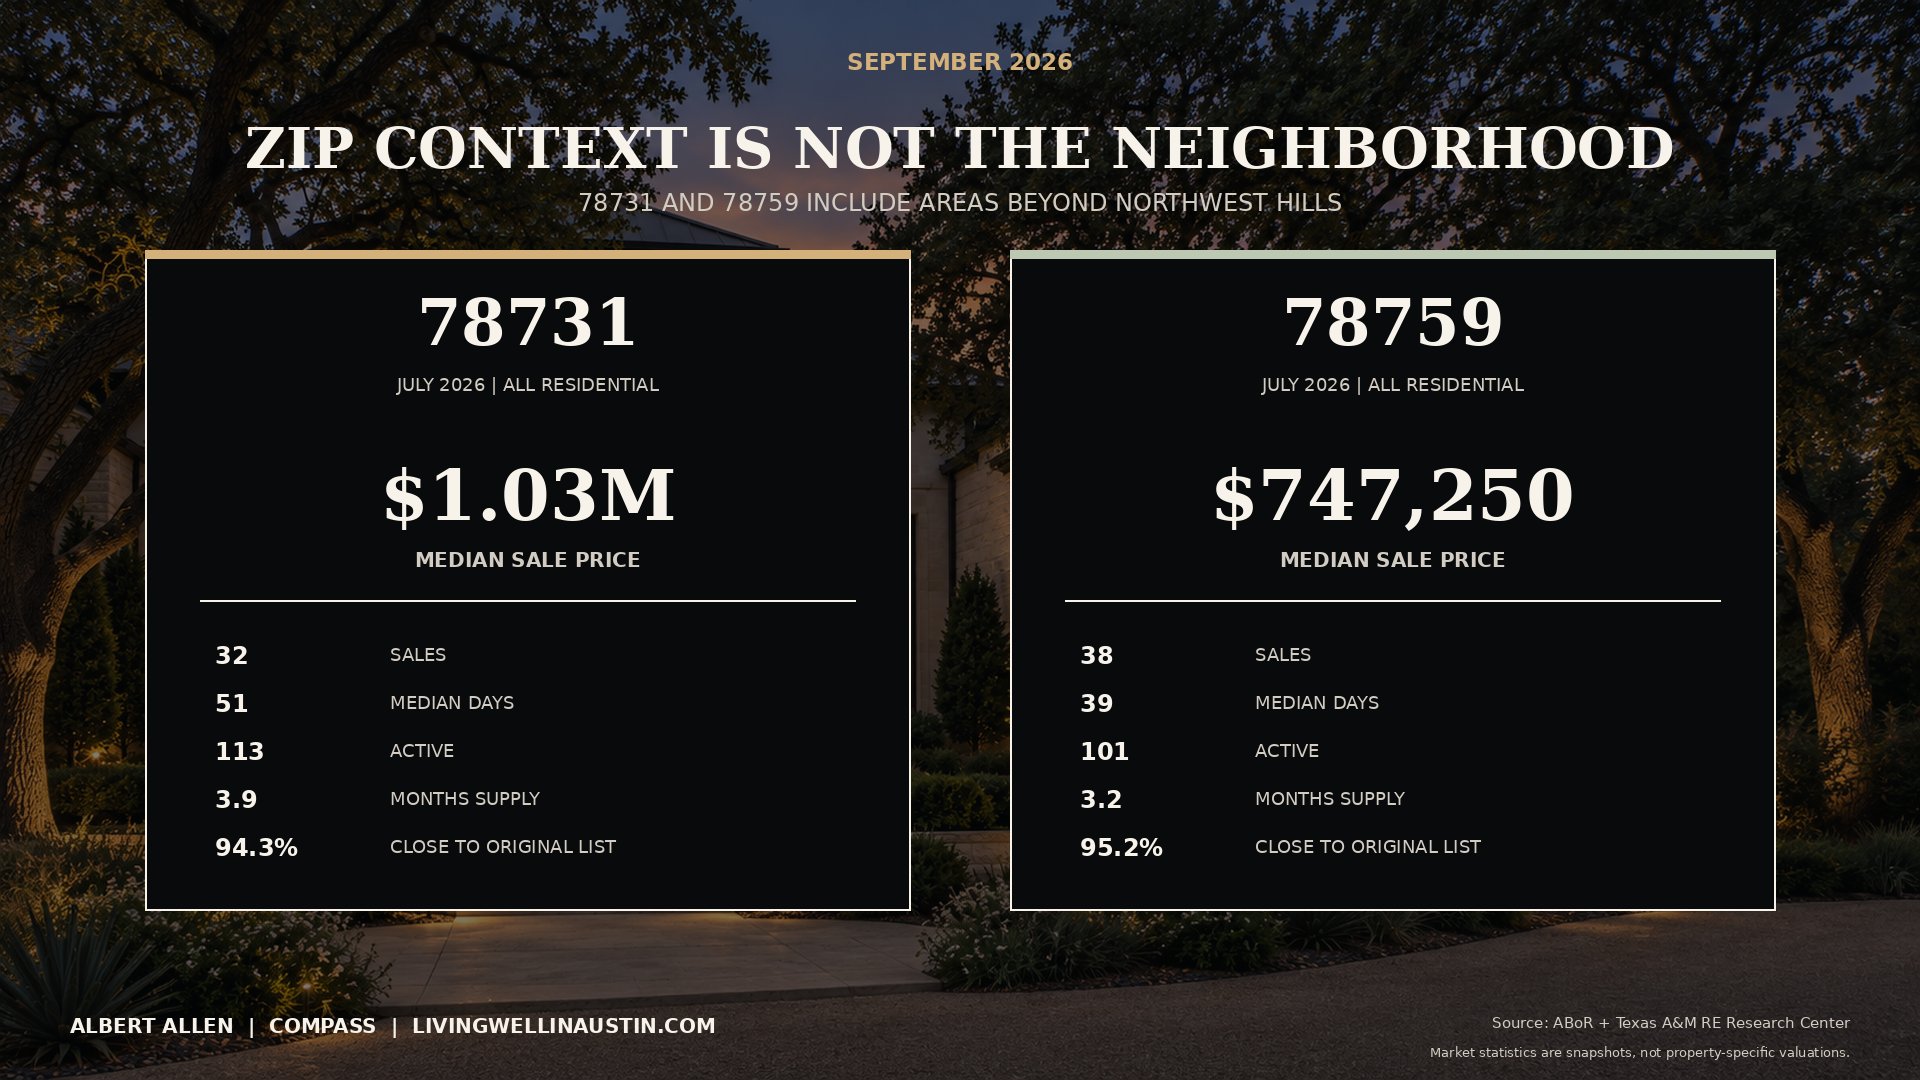
In July 2026, all residential sales in 78731 had a $1.03 million median price, 32 sales, 51 median days on market, 113 active listings and 3.9 months of supply. The close-to-original-list ratio was 94.3%. In 78759, the median was $747,250, with 38 sales, 39 median days on market, 101 active listings and 3.2 months of supply. Its close-to-original-list ratio was 95.2%.
These ZIP-level figures are useful for nearby competition and search behavior. For a pricing decision, use the narrowest credible comparable set for the property itself.
Austin’s luxury tier looked more balanced
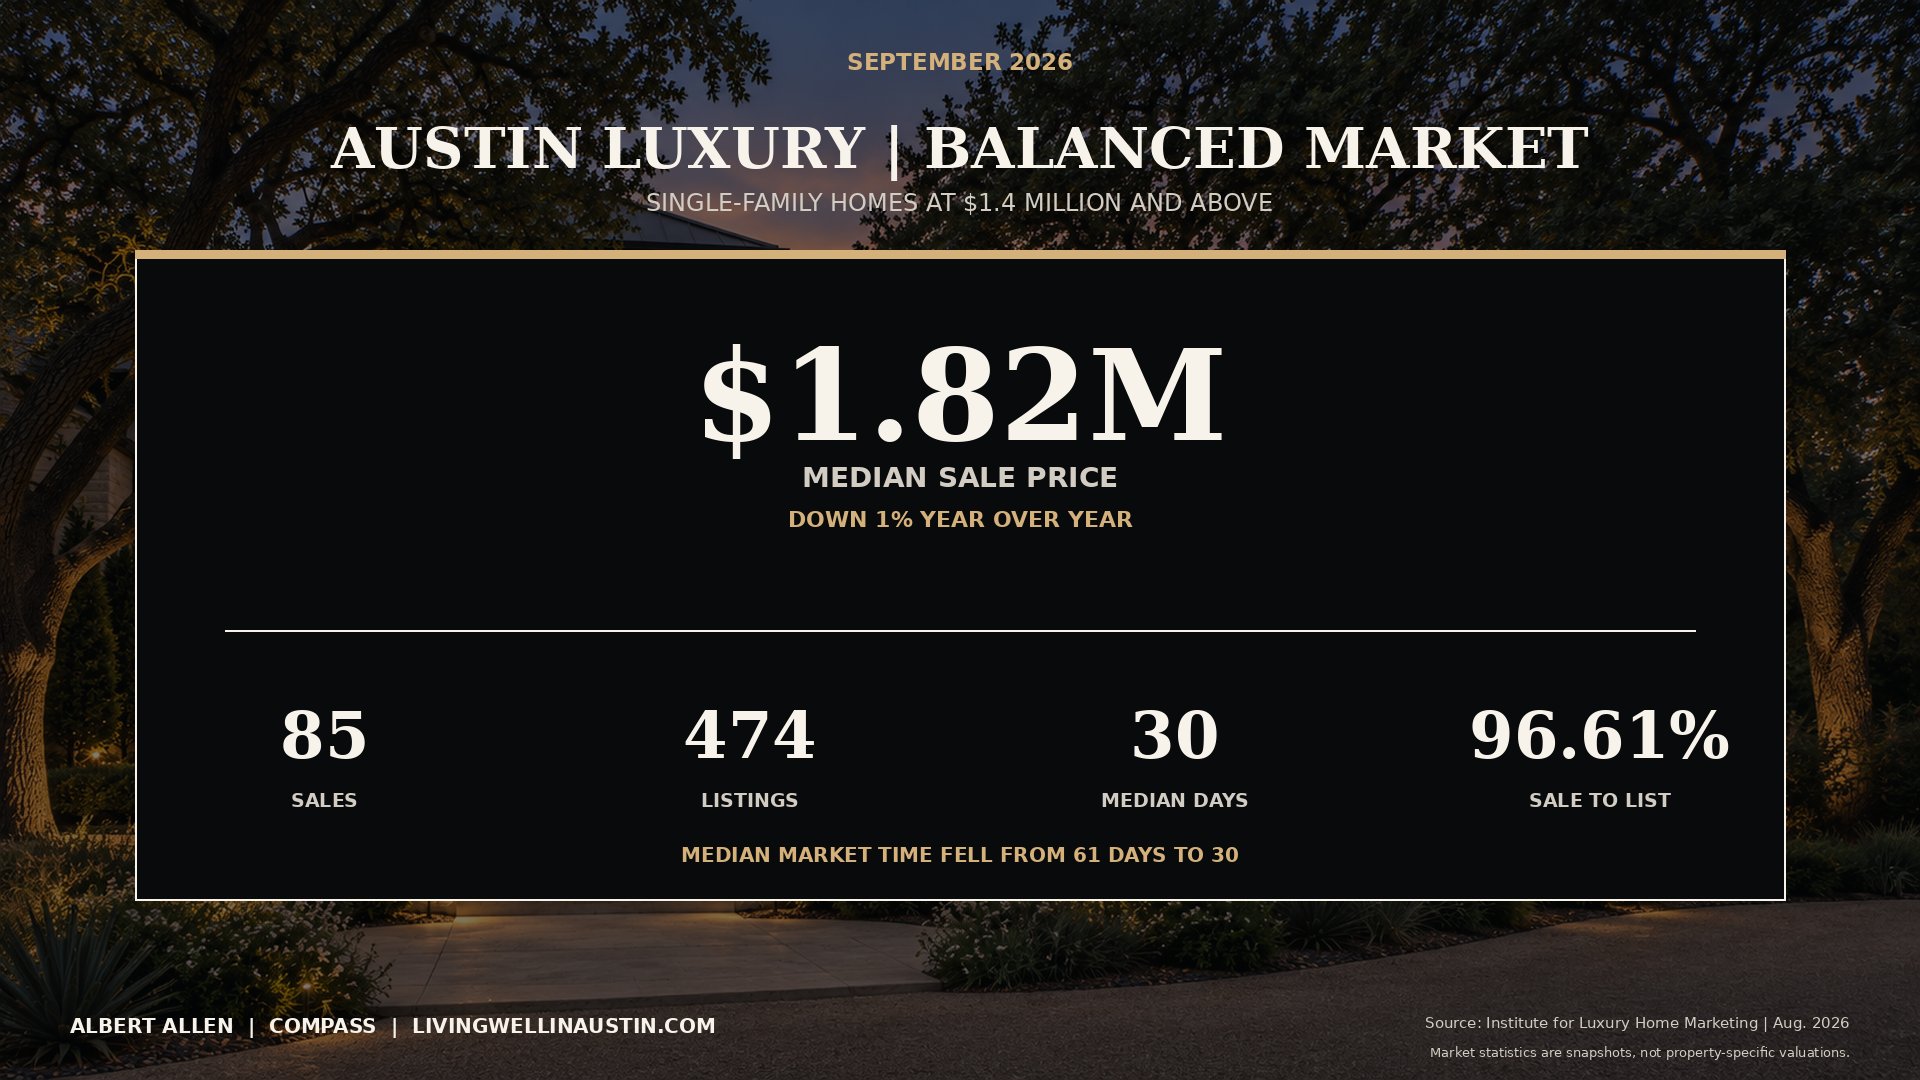
For Austin single-family homes priced at $1.4 million and above, the Institute for Luxury Home Marketing classified the August market as balanced. The median sale price was $1.82 million, down 1% year over year. The segment recorded 85 sales, 474 active listings and a 30-day median time on market, compared with 61 days a year earlier. The sale-to-list ratio was 96.61%.
Balanced does not mean uniform. Distinctive homes can draw attention quickly, while aspirational pricing can leave even strong properties exposed to longer marketing times. In this tier, presentation, launch timing, private-showing feedback and competitive positioning deserve as much attention as the broad median.
New construction needs the most context
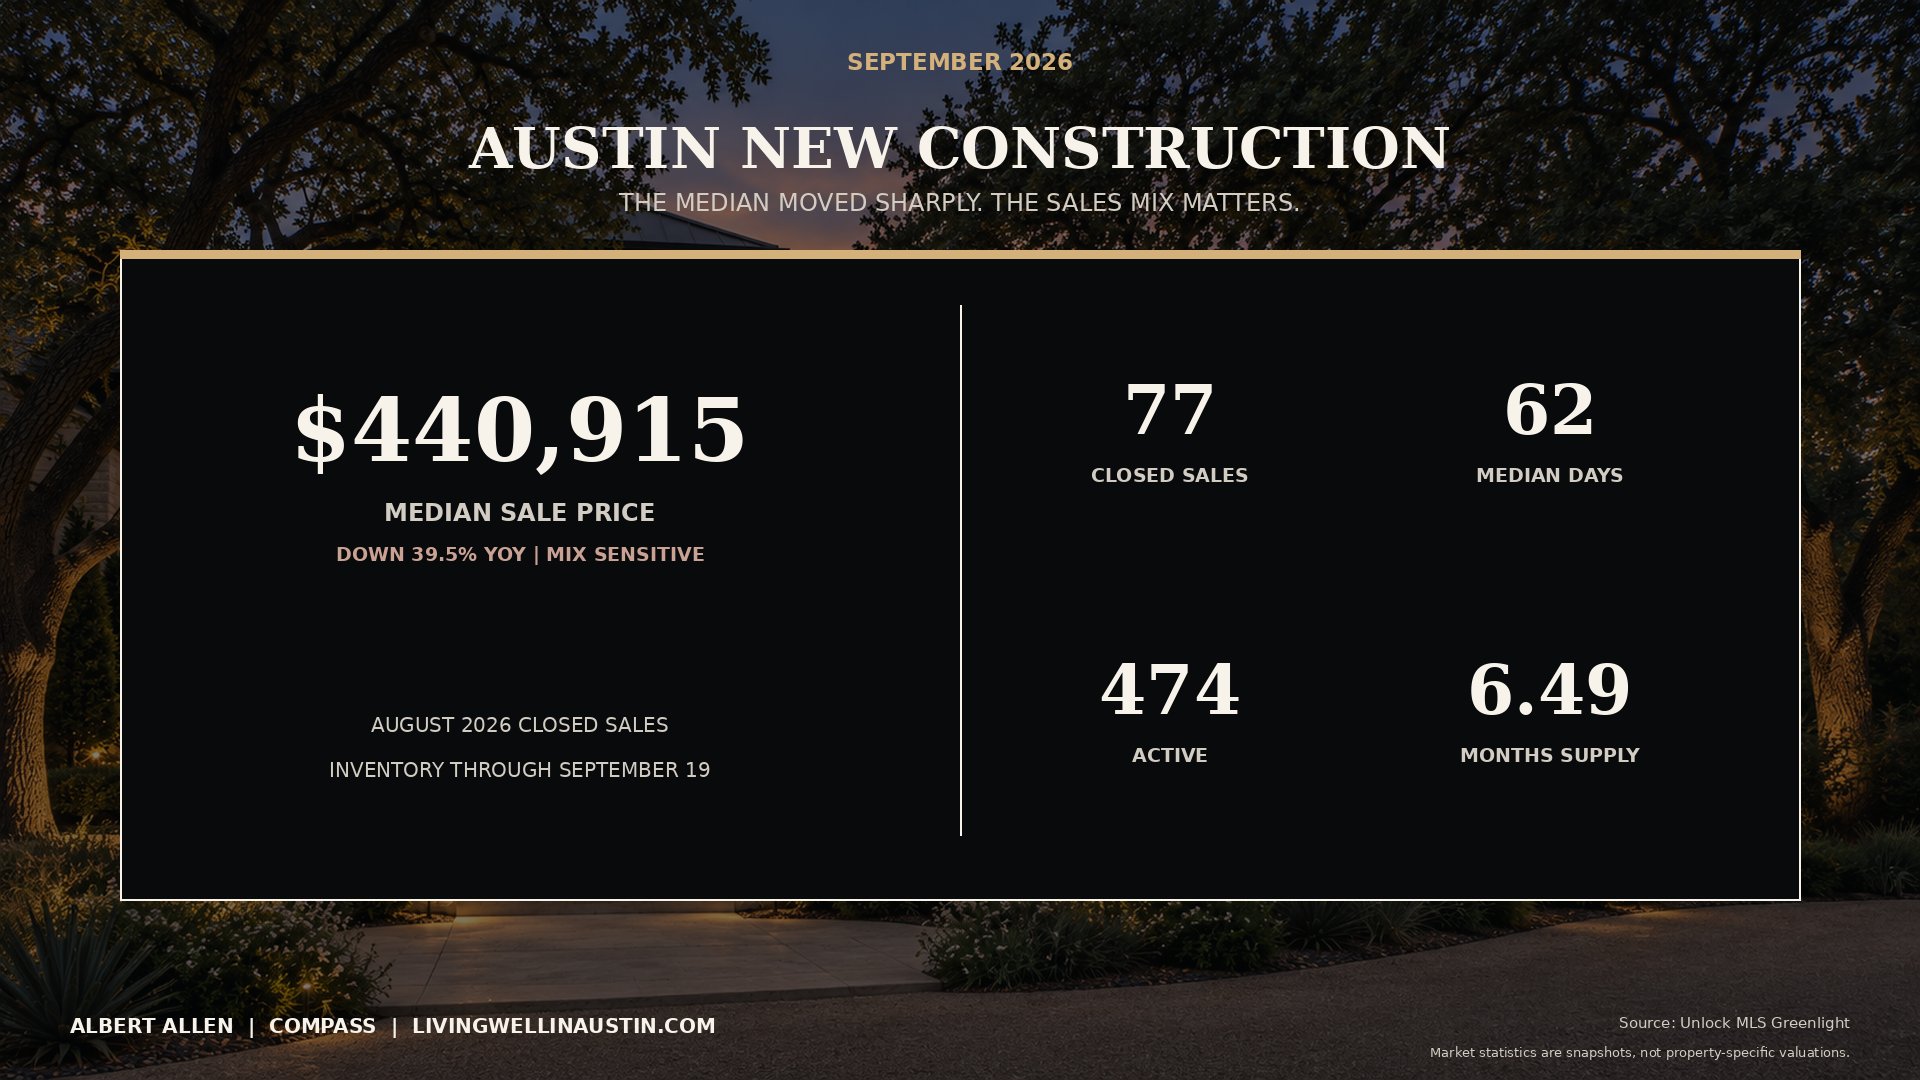
Austin recorded 77 new-construction closings in August, down 14.4% year over year. The median sale price was $440,915, down 39.5%, while the median time to contract was 62 days, three days slower. Active inventory totaled 474 homes, equal to 6.49 months of supply. New listings fell 26.7% to 121, and new contracts fell 4.2% to 69.
The 39.5% median decline is striking, but it is especially sensitive to sales mix. If more attached homes, smaller floor plans or lower-priced communities close in one period, the median can fall without indicating that every new home declined by the same percentage. Builder incentives, financing offers, inventory status, taxes, warranties and upgrade costs should be compared alongside the headline price.
Before the final walk-through, review what to expect from a home inspection in Texas. To see current communities and inventory, browse Austin-area new construction.
What the data means for buyers, sellers and relocations
For Austin buyers
More inventory can create choice and negotiating room, especially when a listing has been on the market or has already adjusted its price. Compare the specific home with recent nearby sales, review condition carefully, and evaluate the full monthly cost rather than relying on the citywide median.
Start with the Austin buyer guide. Condo buyers can also review this guide to understanding downtown Austin condo documents before making an offer.
For Austin sellers
The data favors preparation and precise positioning. Set the launch price from property-level comparables, make the first two weeks count, and use showing activity and feedback as live market evidence. A strong neighborhood result is not permission to overprice, and a soft citywide median is not proof that a well-positioned home cannot sell well.
Request a seller consultation or begin with a home valuation. If the property is a downtown condo, see the analysis of the best time to list a downtown condo.
For people relocating to Austin
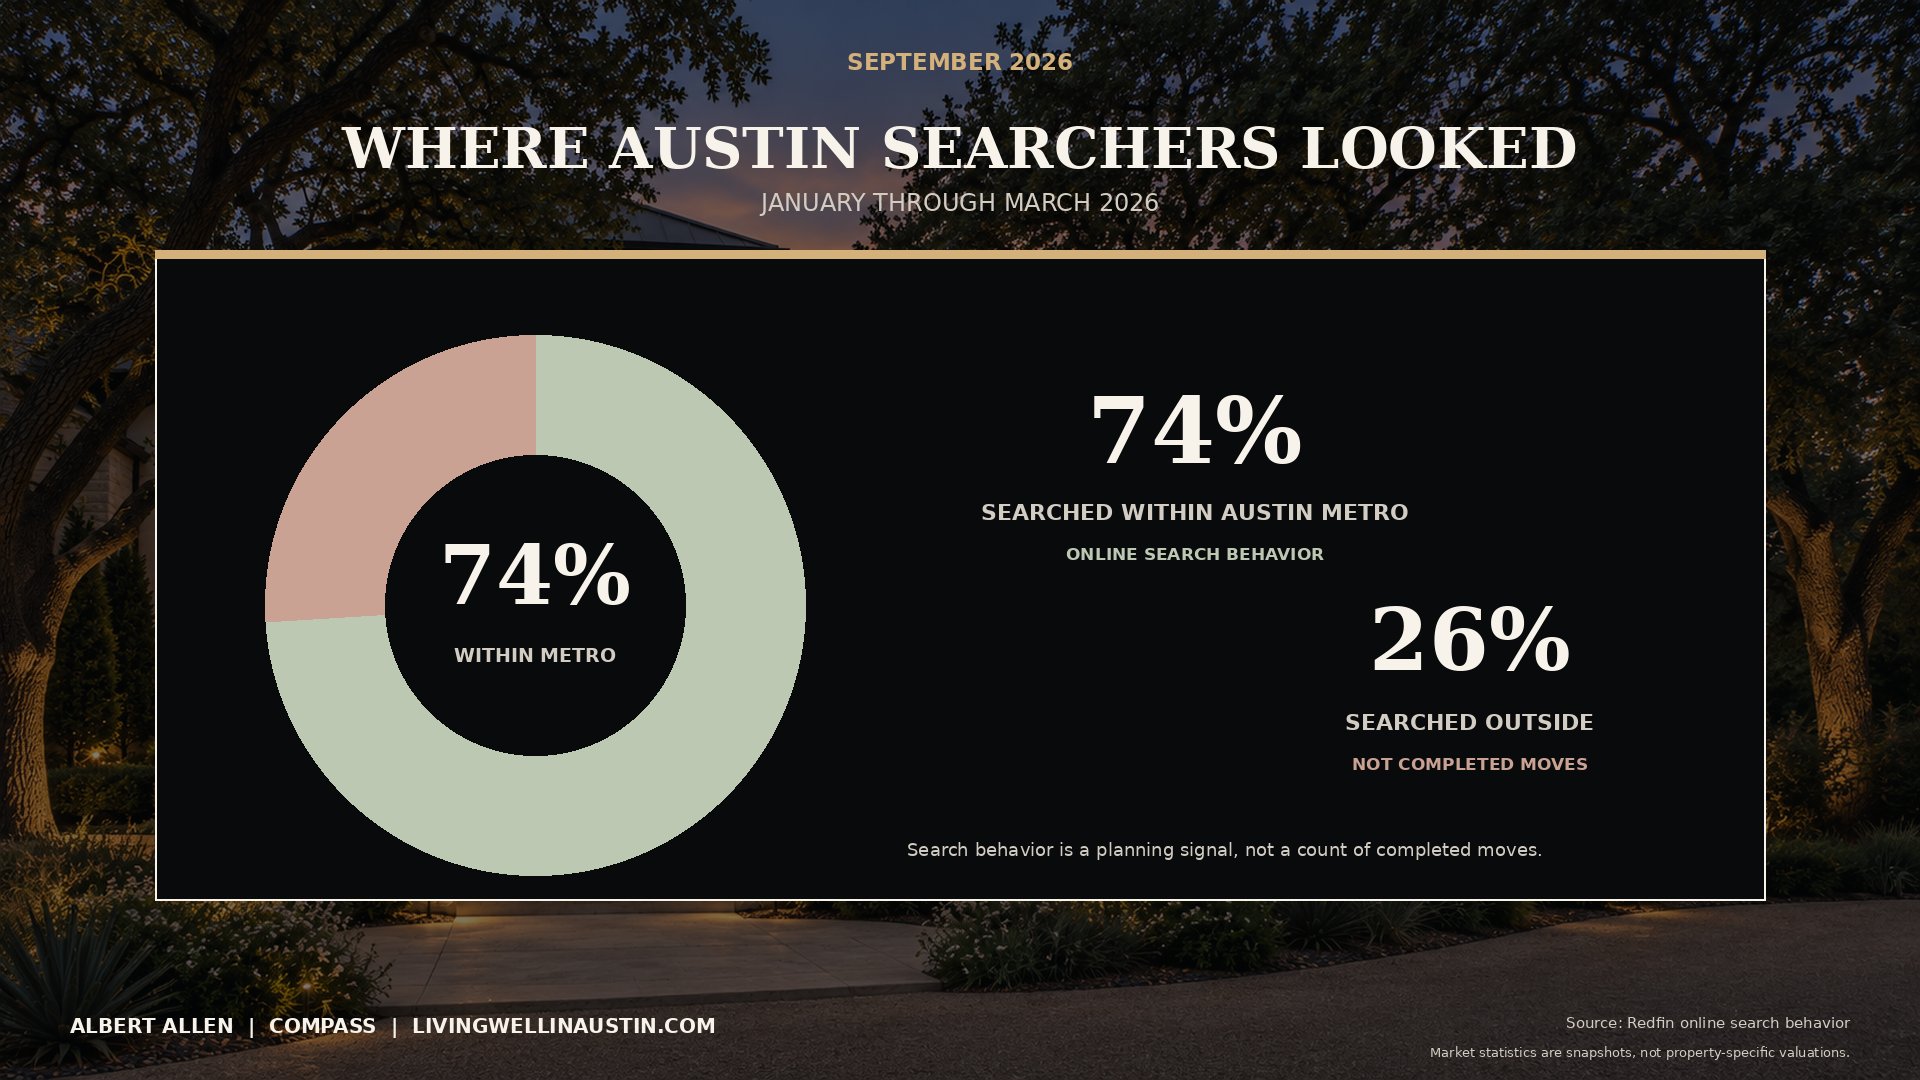
Redfin’s January through March 2026 search data showed 74% of Austin-area searches staying within the metro and 26% coming from outside it. This is online search behavior, not a count of completed moves, but it underscores the value of comparing neighborhoods and product types before narrowing the search.
Use the Austin relocation guide to organize the move around housing needs, commute patterns and timing.
Frequently asked questions
Is Austin a buyer’s market in September 2026?
Austin buyers generally have more choice than they did in a tighter market, with 5.29 months of supply in the city and 6.49 months for new construction. The balance still varies by location, price, property type and condition, so the answer for a specific home may differ from the citywide picture.
Are Austin home prices falling?
The Austin proper median sale price was down 4.3% year over year in August 2026. That is a market-level median, not an automatic change in the value of every home. Sales mix and property-specific factors can produce very different outcomes.
Is Northwest Hills outperforming Austin?
In the periods measured here, Northwest Hills posted a 2.3% annual increase in its median sale price while Austin proper posted a 4.3% decline. The geographies and reporting windows are not identical, so this is useful directional context rather than a direct appraisal comparison.
Why did Austin’s new-construction median fall 39.5%?
The median is highly sensitive to which new homes closed. A month with more lower-priced communities, attached homes or smaller floor plans can produce a steep decline even if individual properties did not lose the same percentage. Review community-level comps and incentives before drawing a conclusion.
Should I buy or sell an Austin home now?
The right timing depends on the property, financing, move date and alternatives available to you. Buyers can benefit from choice and negotiation, while sellers can still succeed with accurate pricing and strong preparation. A property-specific plan is more useful than a citywide forecast.
Sources and methodology
Market statistics in this article are snapshots from different reporting systems, periods and geographic boundaries. They should not be blended as if they were one dataset. The Austin citywide, ZIP-code and new-construction figures use August or July 2026 reporting as identified above. Northwest Hills uses Redfin’s three-month neighborhood view ending August 31. Relocation percentages describe online search behavior from January through March 2026, not completed moves.
- Unlock MLS Greenlight Market Reports
- Redfin Northwest Hills Housing Market
- Redfin Austin Housing Market
- Austin Board of REALTORS and Texas A&M Real Estate Research Center market report supplied for this project.
- Institute for Luxury Home Marketing report supplied for this project.
A property-specific plan
The citywide report is the starting point. For a buying, selling or relocation decision, the next step is a focused review of the property, competing inventory and recent comparable sales.
Explore the buyer guide, schedule a seller consultation, use the relocation guide, or request a home valuation.
Albert Allen | Compass | LivingWellinAustin.com
Market statistics are informational snapshots, not appraisals, guarantees or predictions. Equal Housing Opportunity.